— Calendars & Gantt Charts
About Calendars
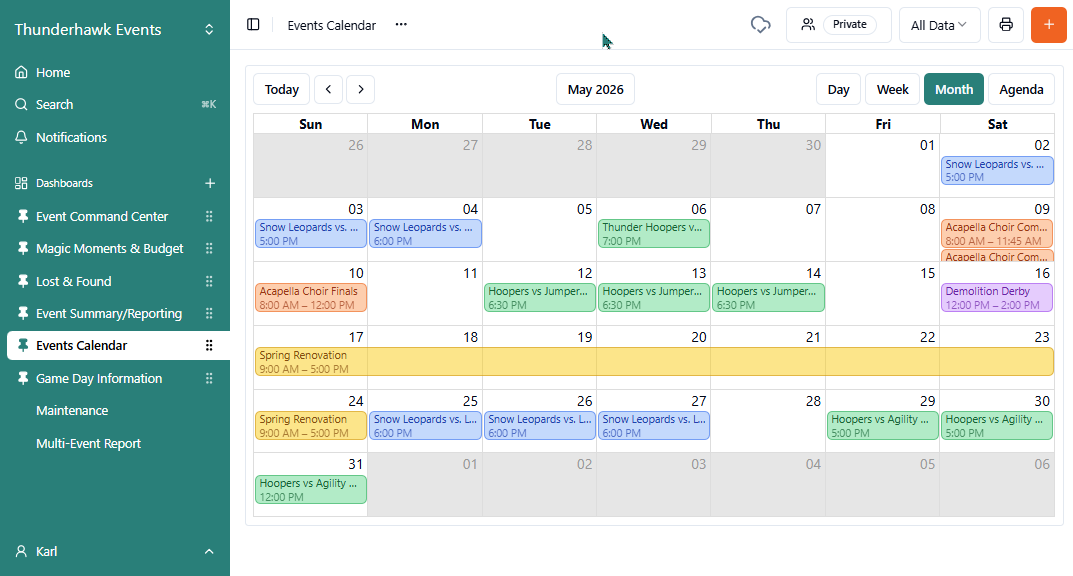
Calendars help sites preview rotation of Events, synchronize daily details, and monitor due dates.
- Calendars can be built for all types of purposes:
- Schedule events
- Plan projects or events
- Display closures or vacations
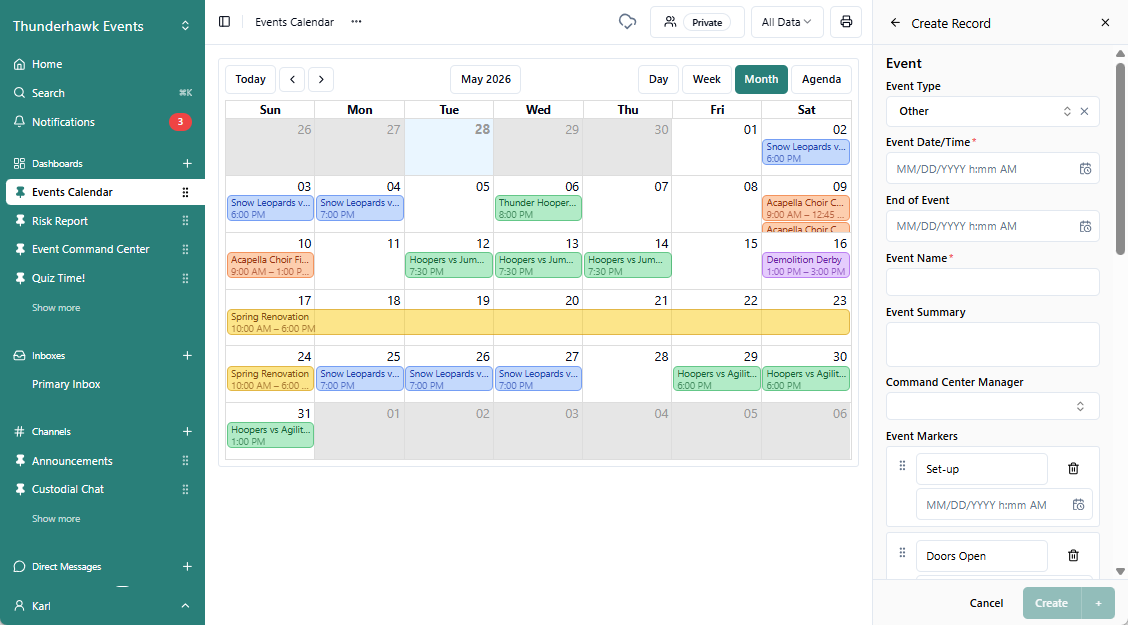
To add Calendar items:
-
Click the orange + Create Record icon
-
Fill in the configured Form → ex. for an Event Form:
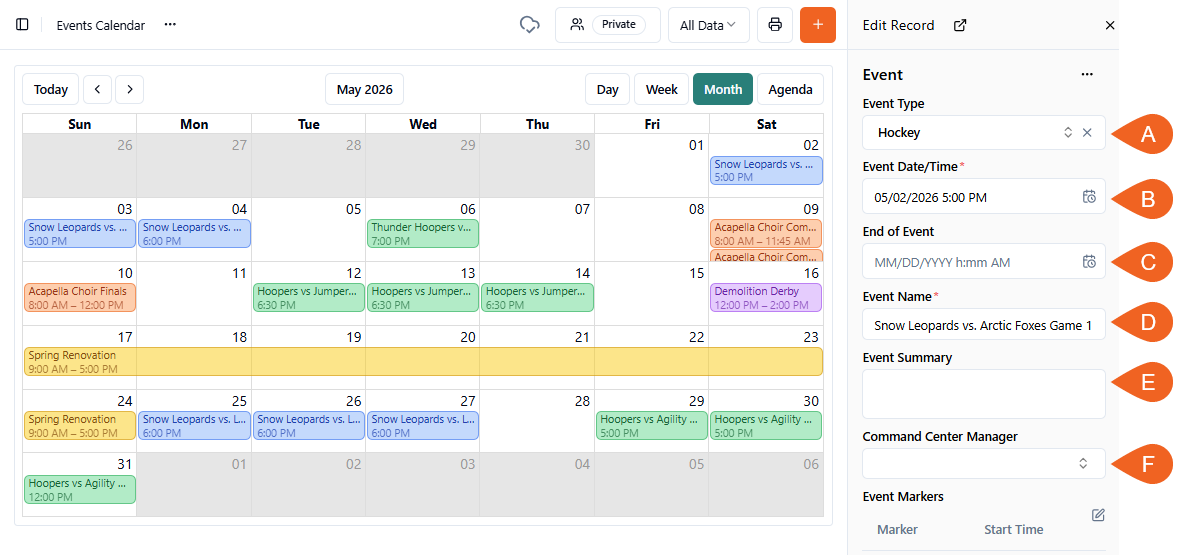
- A. Event Type → pick the project → which is automatically color coded in the calendar
- B. Event Date/Time → *required, choose the Event Start Date and Time
- C. End of Event → optional
- D. Event Name → *required
- E. Event Summary → leave open for AI analysis post-event
- F. Command Center Manager → name also optional
-
And don't forget to select Create
- Calendars are tied to purposely designed Forms → ex. like this Event Form
- Jump to our Calendar Configuration instructions in the Configure Widgets article
About Gantt Charts
A Gantt Chart is a visual timeline — horizontal bars showing when tasks start, how long they run, and when they end — giving venues a cornerstone planning tool to map out future preparations, oversee operational maintenance, and monitor critical milestones.
To add items to a Gantt Chart:
-
Click the orange + Create Record icon
-
Fill in the Form
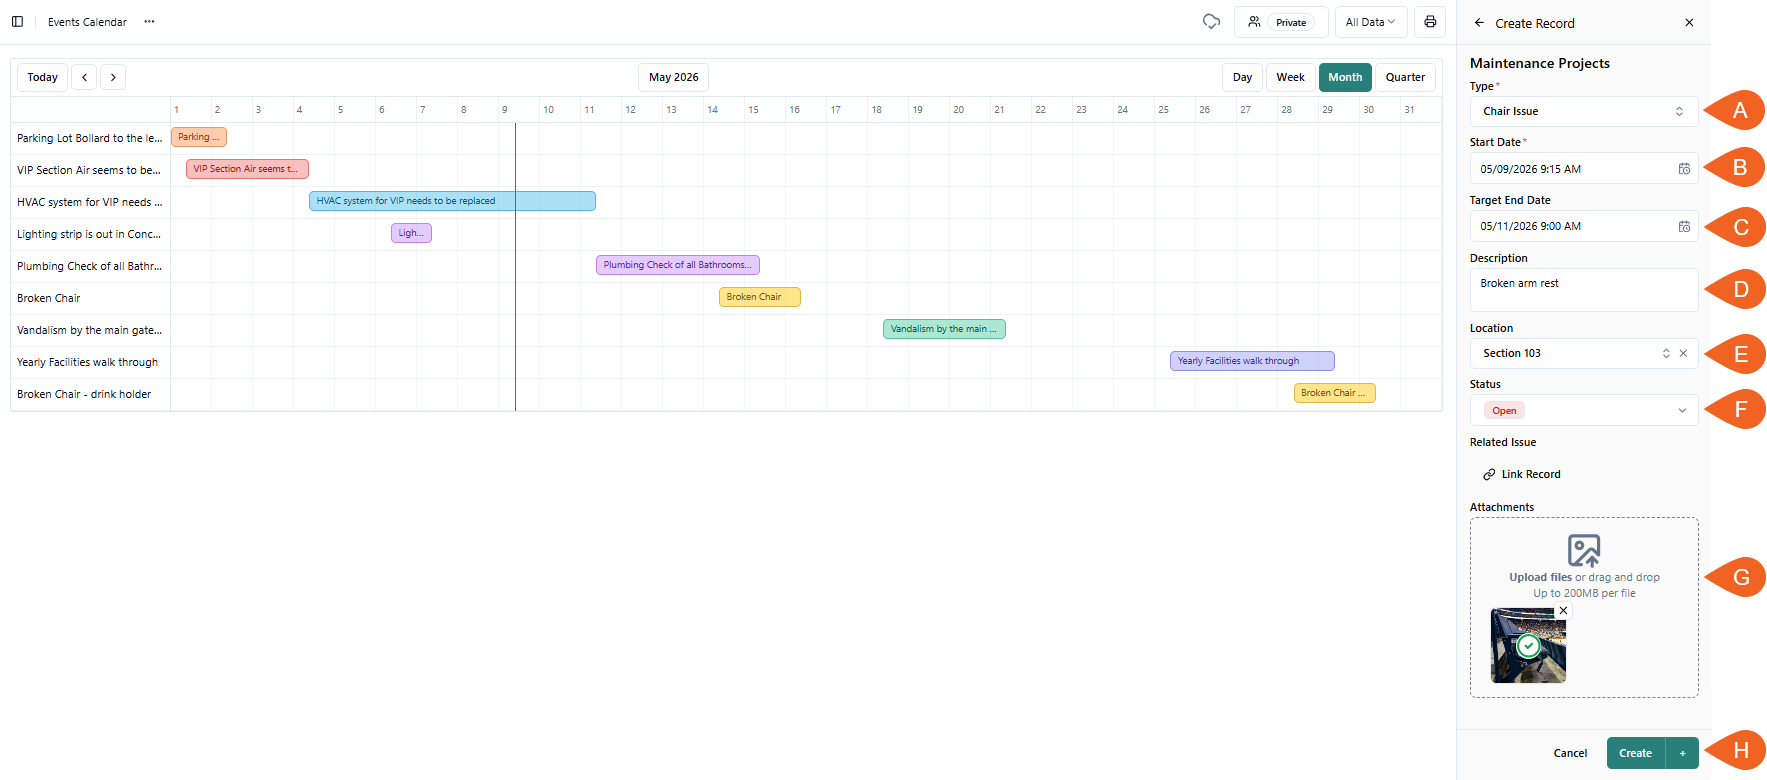
- A. Type → ex. Chair Issue
- B. Start Date Field → ex. Start Date
- C. End Date Field → ex. Target End Date
- E. Description → ex. Broken arm rest
- F. Location → ex. Section 103
- G. Status → ex. Open
- H. Attachments → ex. Image
-
And don't forget to click Create
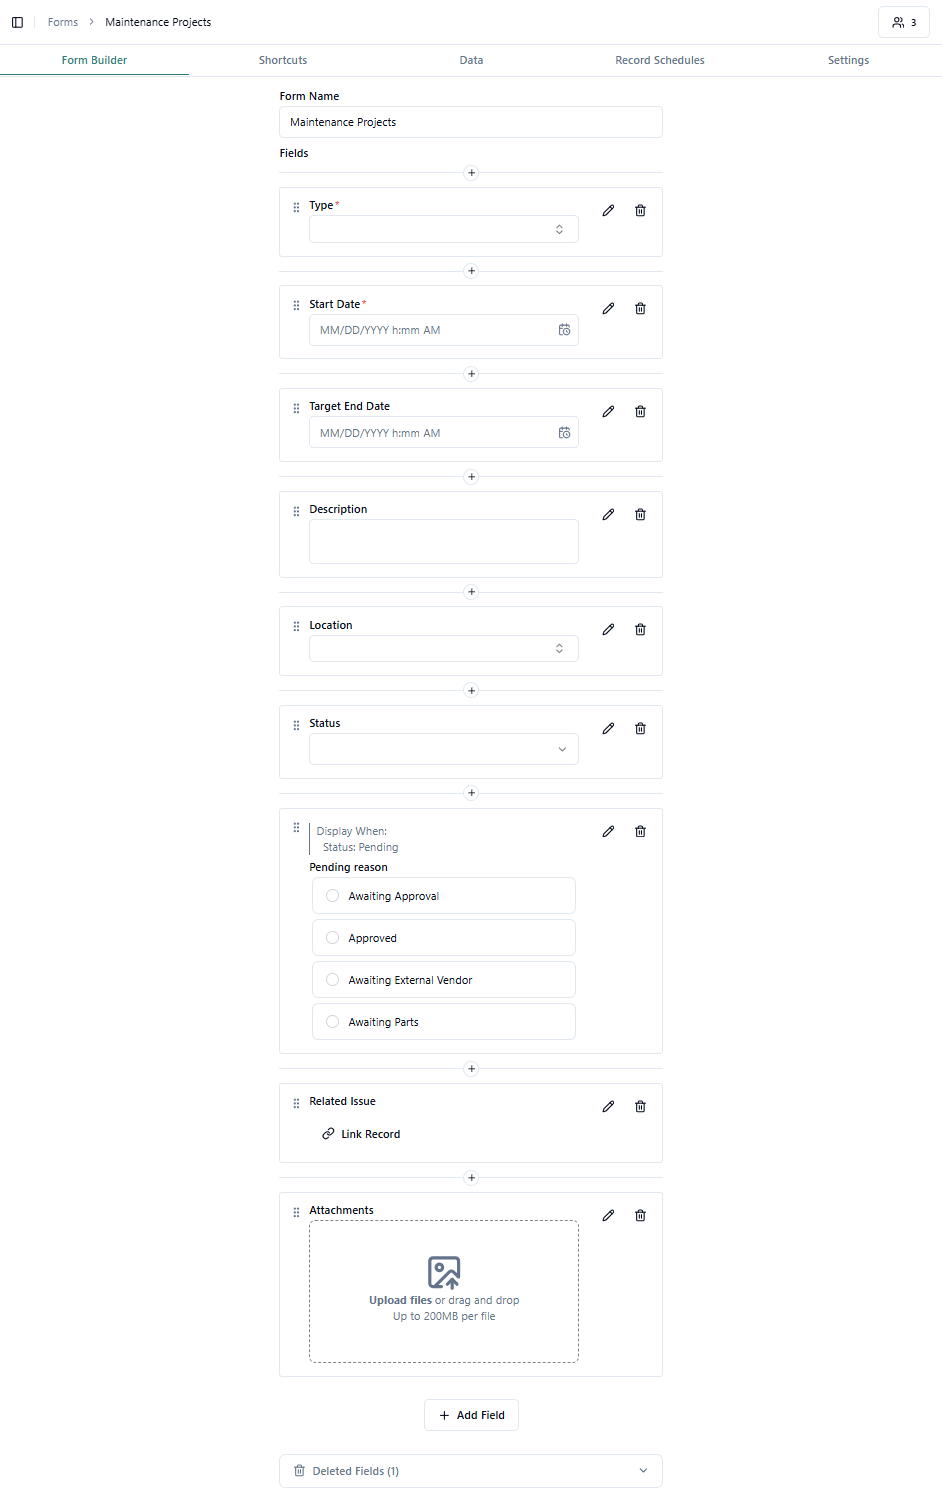
- Ghant Charts are tied to purposely designed Forms → ex. like this Mantenance Form
- Jump to our Calendar Configuration instructions in the Configure Widgets article
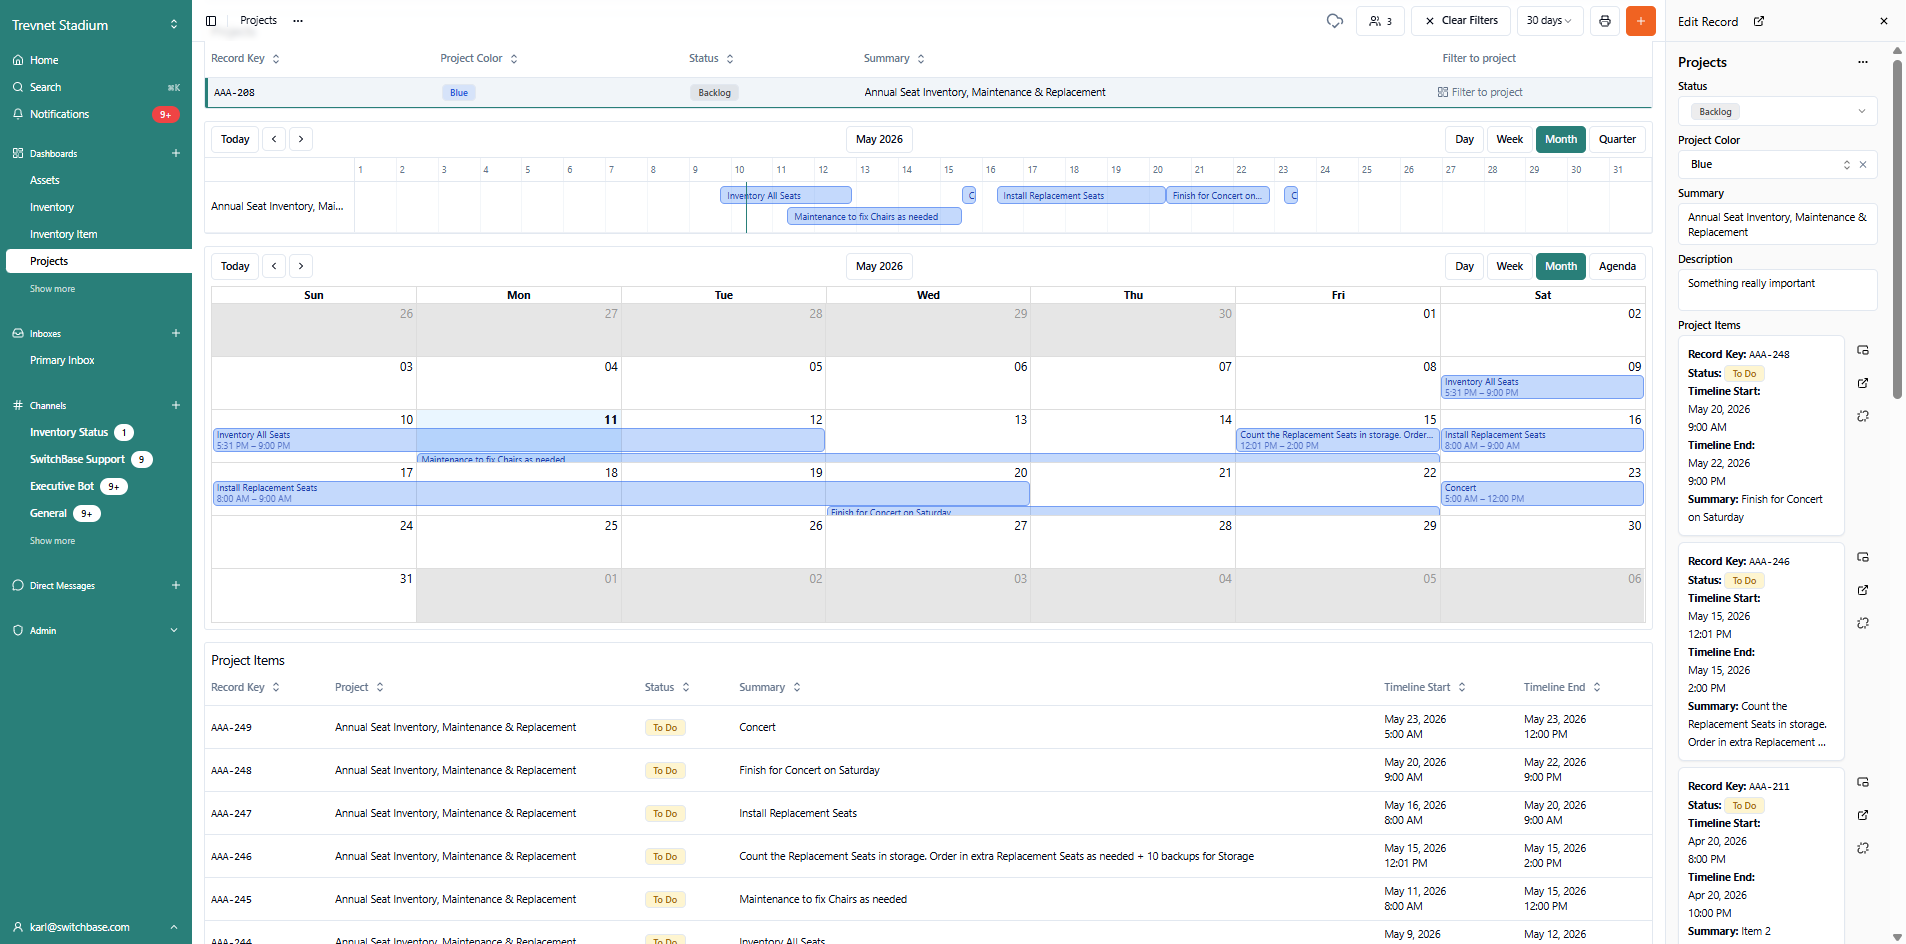
Combine Gantt, Calendars & Tables
You can use the same Forms to generate Calendar, Records Table, and Gantt Chart Widgets and get three perspectives on the same project.
For example, if we filter just 1 project, an Annual Seat Inventory, can see:
- A. Project Filter
- B. Single-line Gantt Chart view (monthly)
- C. Calendar view (monthly)
- D. Project specific Record items
- E. Complete Record contaning it all